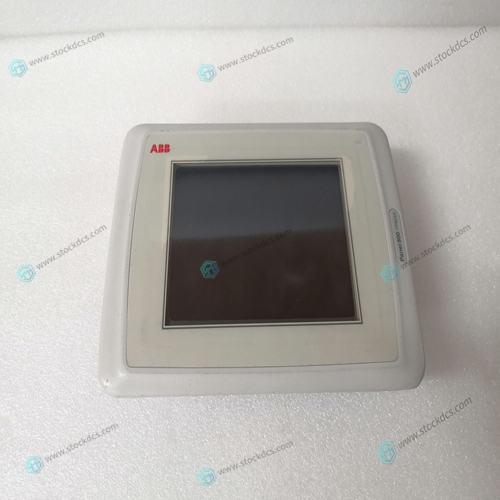
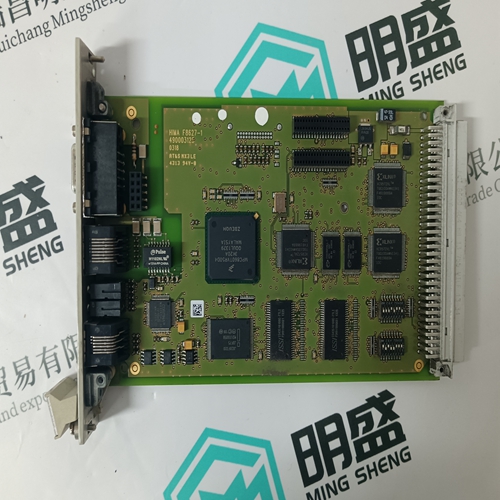
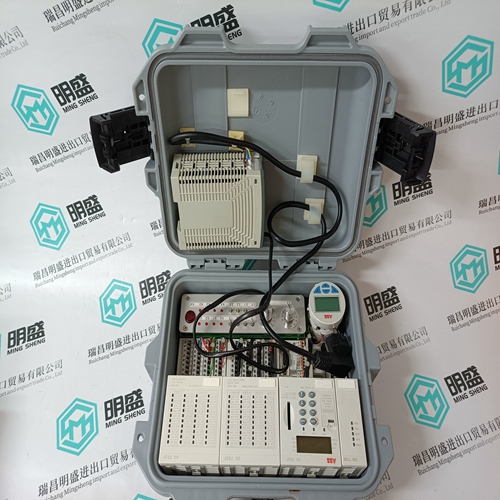
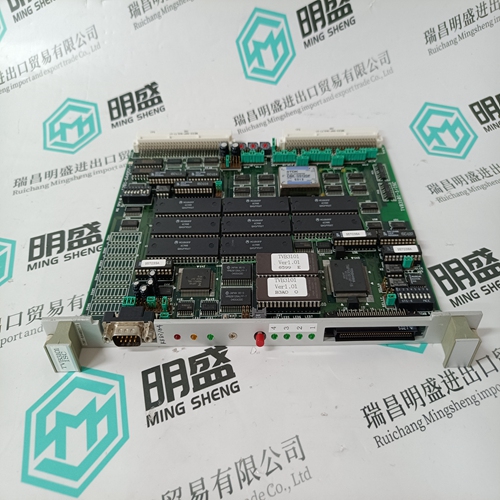
Home > Product > DCS control system > ABB PP825A 3BSE042240R3 Touch screen
ABB PP825A 3BSE042240R3 Touch screen
- Product ID: PP825A 3BSE042240R3
- Brand: ABB
- Place of origin: The Swiss
- Goods status: new/used
- Delivery date: stock
- The quality assurance period: 365 days
- Phone/WhatsApp/WeChat:+86 15270269218
- Email:stodcdcs@gmail.com
- Tags:ABBPP825A3BSE042240R3Touch screen
- Get the latest price:Click to consult
ABB PP825A 3BSE042240R3 Touch screen
Data Analyzer The data analyzer mode allows you to view all bytes of data transferred on each port. Both the transmitted and received data bytes are displayed. Use of this feature is limited without a thorough understanding of the protocol.When in analyzer mode, program execution will slow down. Only use this tool during a trouble-shooting session. Before disconnecting from the Config/Debug port, please be sure to press [M] to return to the main menu and Displaying Timing Marks in the Data Analyzer You can display timing marks for a variety of intervals in the data analyzer screen. These timing marks can help you determine communication-timing characteristics.
When in analyzer mode, program execution will slow down. Only use this tool during a trouble-shooting session. Before disconnecting from the Config/Debug port, please be sure to press [S] to stop the Data Analyzer before returning to the main menu or disconnecting from the port. This action will allow the module to resume its normal operating mode.
Data Analyzer Tips
From the main menu, press [A] for the "Data Analyzer". You should see the following text appear on the screen:From this menu, you can select the "Port", the "format", and the "ticks" that you can display the data in. For most applications, HEX is the best format to view the data, and this does include ASCII based messages (because some characters will not display on HyperTerminal and by capturing the data in HEX, we can figure out what the corresponding ASCII characters are supposed to be). The Tick value is a timing mark. The module will print a _TT for every xx mSec of no data on the line. Usually 10msec is the best value to start with. After you have selected the Port, Format, and Tick, we are now ready to start a capture of this data.
After selecting the above option, the following window will appear:
Next name the file, and select a directory to store the file in. In this example, we are creating a file ProSoft.txt and storing this file on our root C: drive. After you have done this, press the button. Now you have everything that shows up on the HyperTerminal screen being logged to a file called ProSoft.txt. This is the file that you will then be able to email to ProSoft Technical Support to assist with issues on the communications network. To begin the display of the communications data, you will then want to press 'B' to tell the module to start printing the communications traffic out on the debug port of the module. After you have pressed 'B', you should see something like the following


Quality assurance service
1. We provide high-quality parts of various brands, and you will find full
The model meets your needs.
2. For models that have been out of production for many years, we have all hard to find parts, so we can directly find us to solve all problems for you at one time.
3. If you are in a hurry to use this product, we can dispatch it for you.
4. All products can enjoy a one-year warranty service,
5. Our products are new and unused.
6. If you need a large quantity, you can contact us and I can offer you a discount.
7. You can ask me about the price and more information about the product via email. We welcome you
