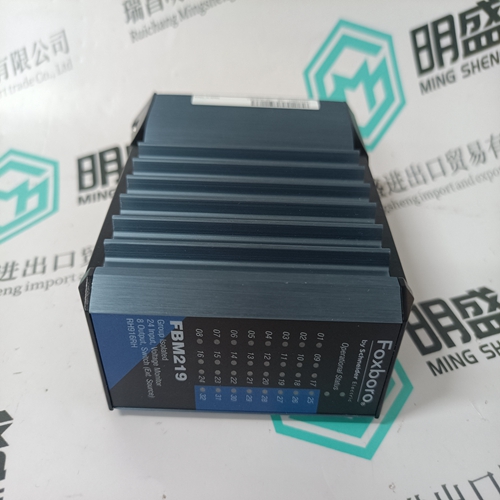
Home > Product > DCS control system > TRICONEX DI2301 Communication module
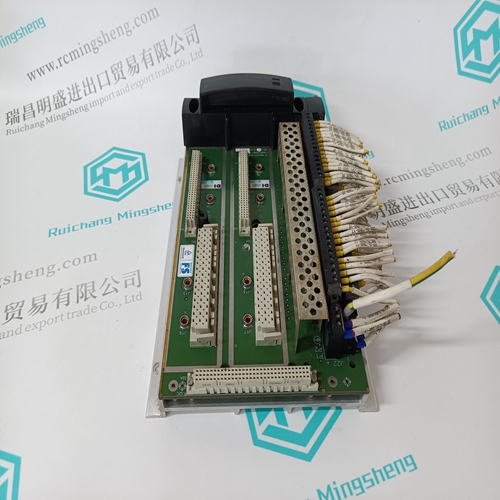
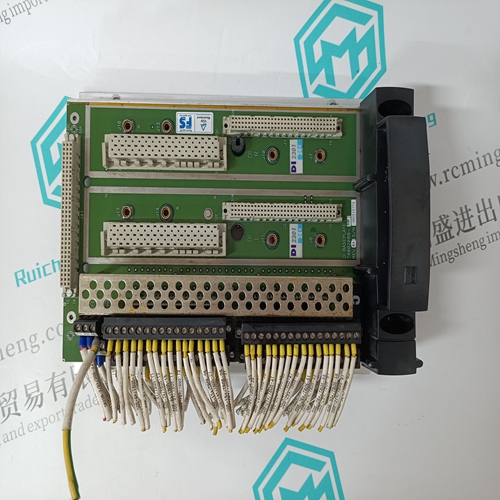
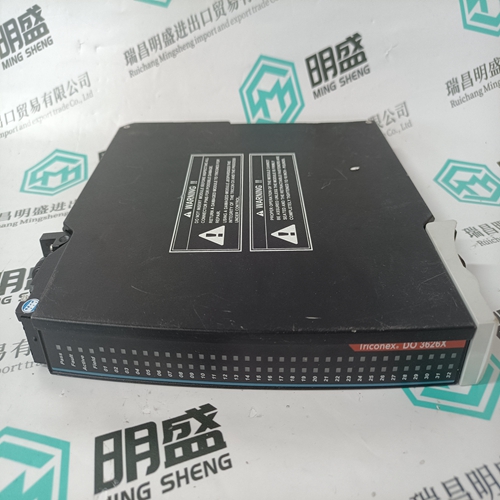
TRICONEX DI2301 Communication module
- Product ID: DI2301
- Brand: TRICONEX
- Place of origin: The United States
- Goods status: new/used
- Delivery date: stock
- The quality assurance period: 365 days
- Phone/WhatsApp/WeChat:+86 15270269218
- Email:stodcdcs@gmail.com
- Tags:TRICONEX DI2301Communication module
- Get the latest price:Click to consult
The main products
Spare parts spare parts, the DCS control system of PLC system and the robot system spare parts,
Brand advantage: Allen Bradley, BentlyNevada, ABB, Emerson Ovation, Honeywell DCS, Rockwell ICS Triplex, FOXBORO, Schneider PLC, GE Fanuc, Motorola, HIMA, TRICONEX, Prosoft etc. Various kinds of imported industrial parts
Products are widely used in metallurgy, petroleum, glass, aluminum manufacturing, petrochemical industry, coal mine, papermaking, printing, textile printing and dyeing, machinery, electronics, automobile manufacturing, tobacco, plastics machinery, electric power, water conservancy, water treatment/environmental protection, municipal engineering, boiler heating, energy, power transmission and distribution and so on.
TRICONEX DI2301 Communication module
Viewing Port Communication Status Press [1] from the Main Menu to view the port communication status for the application port. Use this command to view communication status and statistics for the selected port. This information can be informative when trouble-shooting communication problems. Viewing Port Configuration Press [6] from the Main Menu to view configuration information for the application port. Use this command to display detailed configuration information for the port. Cold Booting the Module Press [ESC] to restart the module and force all drivers to be loaded. The module will use the configuration stored in the module's flash memory to configure the module.Use this menu to view the command error list for the module. Press [?] to view a list of commands available on this menu.
Data Analyzer
The data analyzer mode allows you to view all bytes of data transferred on each port. Both the transmitted and received data bytes are displayed. Use of this feature is limited without a thorough understanding of the protocol. Note: The Port selection commands on the Data Analyzer menu differs very slightly in different modules, but the functionality is basically the same. Use the illustration above as a general guide only. Refer to the actual data analyzer menu on your module for the specific port commands to use. Important: When in analyzer mode, program execution will slow down. Only use this tool during a troubleshooting session. Before disconnecting from the Config/Debug port, please press [S] to stop the data analyzer, and then press [M] to return to the main menu. This action will allow the module to resume its normal high speed operating mode. Analyzing Data for the first application port Press [1] to display I/O data for the first application port in the Data Analyzer. The following illustration shows an example of the Data Analyzer output.
Stopping the Data Analyzer
From this menu, you can select the "Port", the "format", and the "ticks" that you can display the data in. For most applications, HEX is the best format to view the data, and this does include ASCII based messages (because some characters will not display on HyperTerminal and by capturing the data in HEX, we can figure out what the corresponding ASCII characters are supposed to be). The Tick value is a timing mark. The module will print a _TT for every xx milliseconds of no data on the line. Usually 10milliseconds is the best value to start with.After you have selected the Port, Format, and Tick, we are now ready to start a capture of this data. The easiest way to do so is to go up to the top of you HyperTerminal window Next name the file, and select a directory to store the file in. In this example, we are creating a file ProSoft.txt and storing this file on our root C: drive. After you have done this, press the button.
